BI & Dashboards
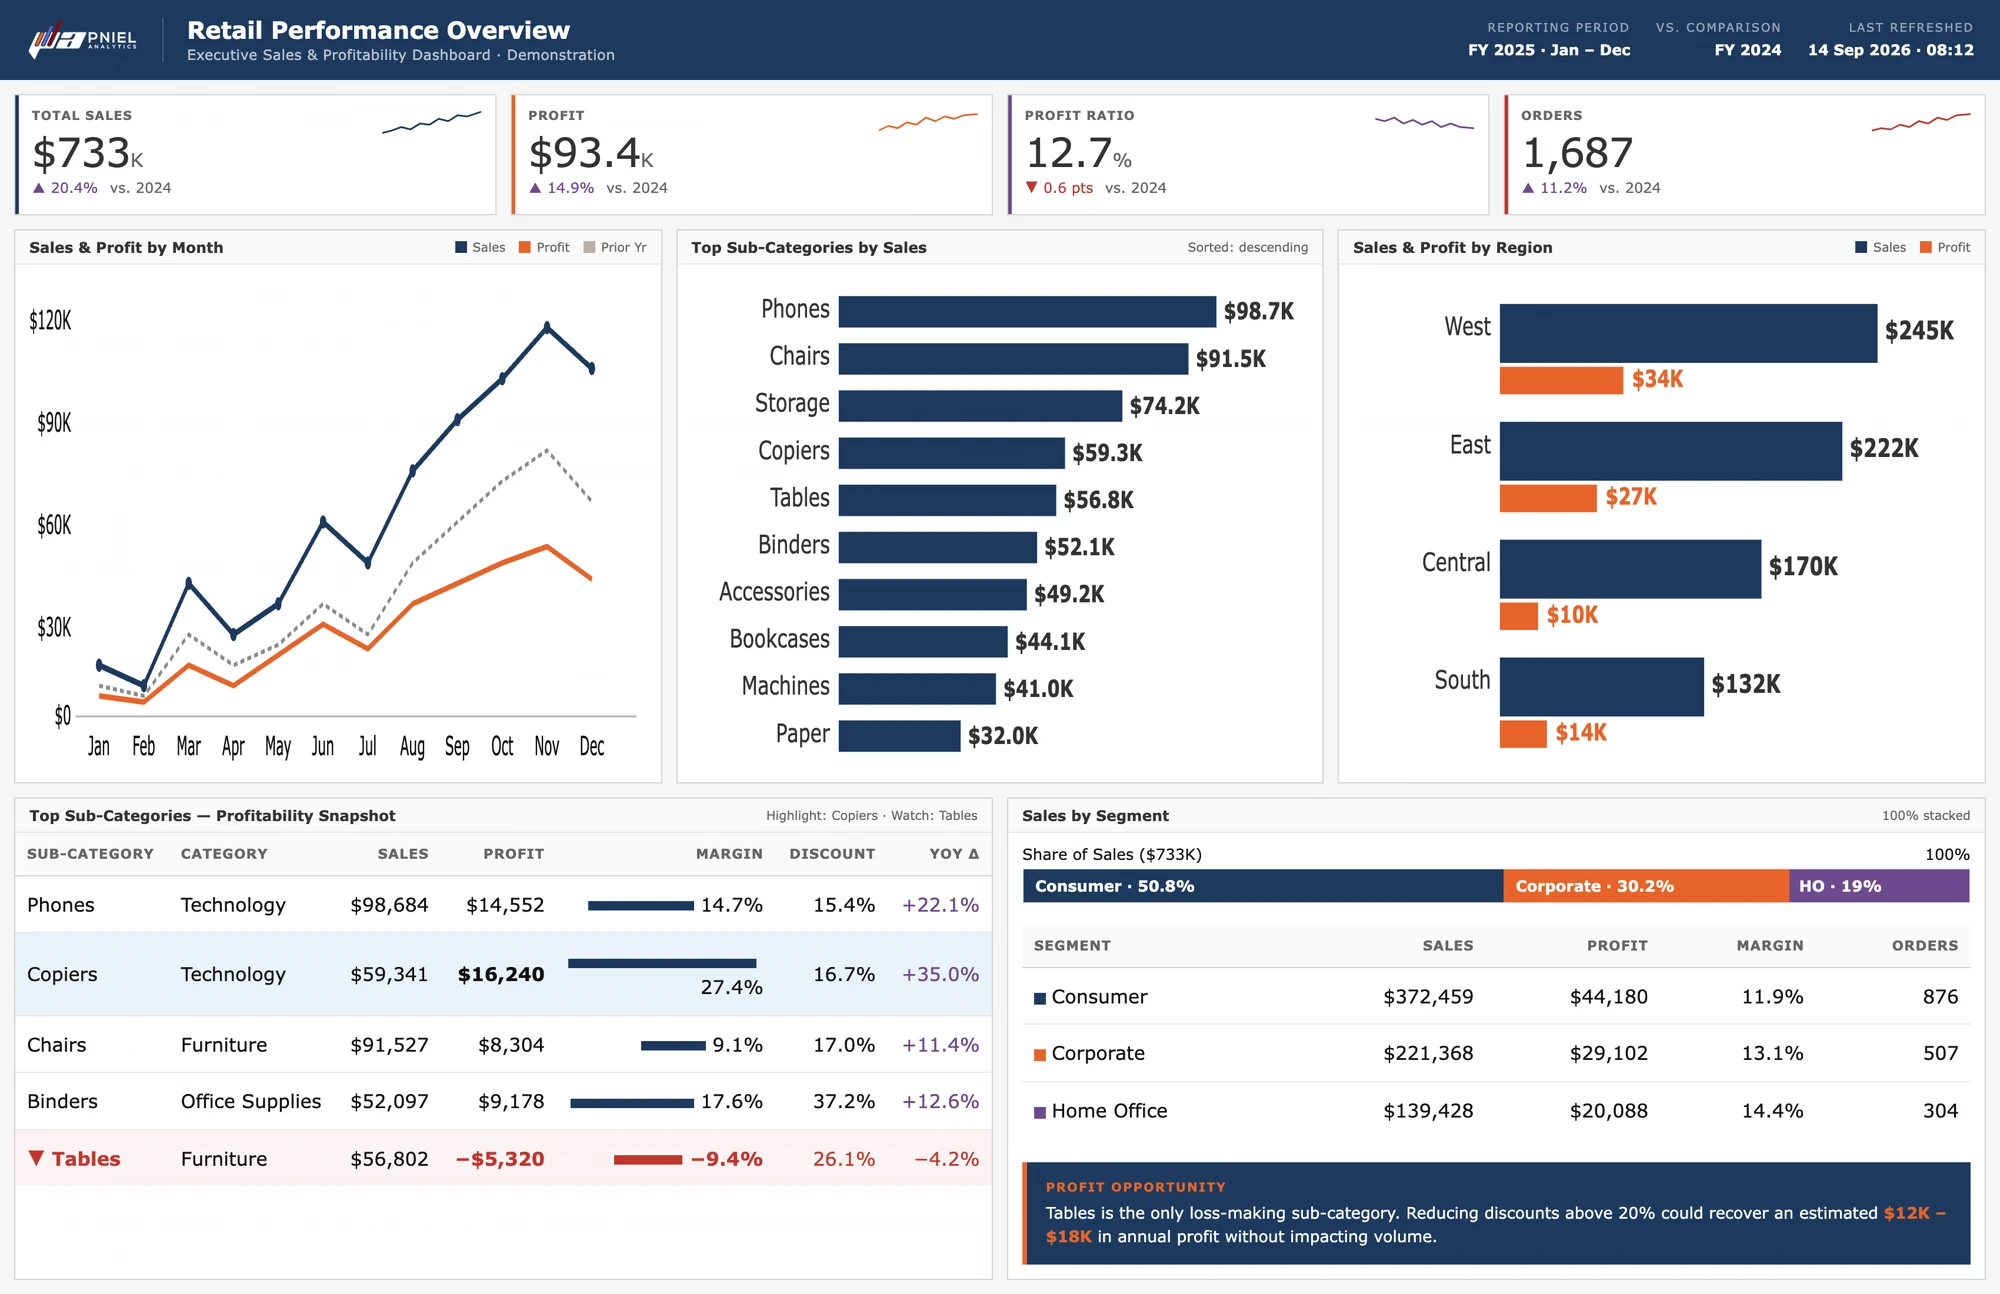
Executive dashboards and automated reporting in Tableau and Power BI. One trusted, real-time view of performance, built for the people making the decisions.
Explore BI & Dashboards →
Business Intelligence & Analytics
Pniel Analytics transforms fragmented business data into automated Tableau and Power BI dashboards that drive faster, confident decisions.
We work in the tools your team already trusts
What we do
We build your dashboards, plan your data, and predict what’s coming next. Done deeply, not spread thin.
Executive dashboards and automated reporting in Tableau and Power BI. One trusted, real-time view of performance, built for the people making the decisions.
Explore BI & Dashboards →Roadmaps, metric governance, and integration that turn disconnected systems into one reliable foundation you can build on.
Explore Data Strategy →Forecasting, segmentation, and predictive models that help you act on what’s coming, not just report what already happened.
Explore Advanced Analytics →Success stories
Real analytics work across healthcare, finance, retail, and more.
Showing 9 of 9 stories
 HEALTHCARE
A Tableau dashboard that gives healthcare teams one place to track patient assessments, watch outcomes, and spot where care needs attention.
40% improvement in patient assessment efficiency SAAS
SAASA Tableau KPI tracker that scores goals against actuals with clear on-track, at-risk, and off-track status so teams always know where they stand.
Target vs. actual scoring across every KPI FINANCIAL SERVICES
An interactive Tableau dashboard for financial statements, so stakeholders can track performance and catch the trends that matter without digging through spreadsheets.
60% faster financial reporting process CRIME ANALYSISIndependent Project
An independent analysis of publicly available Maryland crime data, built as a Tableau dashboard to explore multi-year violent crime trends across counties and show how open data can be turned into clear, decision-ready visuals.
Multi-decade crime trends (1975 to 2020) visualized across all counties E-COMMERCE
A live dashboard tracking revenue, conversion rate, average order value, and customer acquisition cost for an online store.
Business metrics update in real time RETAIL
We helped an e-commerce platform lift conversion and tighten its sales funnel using behavioral analytics and a close look at where customers dropped off.
35% increase in conversion rate HEALTHCARE
Predictive analytics that flag high-risk patients early, so care teams can step in before costs climb.
22% reduction in readmission rates MANUFACTURING
Real-time monitoring and predictive maintenance that cut downtime and keep production lines moving.
40% reduction in equipment downtime NON-PROFIT
A sample dashboard concept for non-profits to track donor engagement, fundraising performance, and program impact in one clear view.
Unified view of donations, grants, and program impactHow we work
Every phase keeps your stakeholders aligned and your decisions moving.
We start with the decisions you need to make, then work back to the KPIs, stakeholders, and source systems behind them.
We design the data flows and the dashboards together, checking in with you at every milestone so nothing comes as a surprise.
We launch, train your team, and document everything, so you can run it and extend it without us.
Why Pniel
The honest middle ground. Senior expertise, without the disappearing act or the six-figure invoice.
Most dashboard designers focus on how it looks. We focus on how fast it runs. Around 80% of slow dashboards fail because of the queries behind them, not the design. We find the bottleneck and fix it at the source.
You save months, and often tens of thousands.
A freelancer builds your dashboard and moves on. Six months later your data changes, the dashboard breaks, and there’s no one left to call.
We stand behind our work. If something breaks, fixing it is on us.
A 16-week discovery phase. Junior analysts doing the work. Project managers relaying your words back to you. Four months and $200K later, you finally have a dashboard.
We deliver in 4 to 6 weeks, and you work directly with the person who builds it.
No sales engineer. No account manager. The person writing your SQL is the person you hired, and the same person stays with you the whole way.
Healthcare reporting works differently from retail, and retail works differently from government. We build for what you actually need, not for what fits a template.
Staying small keeps us fast, focused, and efficient, without the overhead. It also means we recognize when you’d be better served by a larger firm. When that’s the case, we’ll tell you.
Client voices
“We contracted with Pniel Analytics to develop a dashboard for the first time in our pooled philanthropic fund's five year history. Despite some inconsistencies in availability of data over funding rounds, Fred did an excellent job of developing a clean, branded dashboard that gives multiple audiences a solid overview of our work. The data challenges resulted in several revisions to thinking around which data elements to include and how to present the data. Fred served as a great thought partner and was patient and flexible as we revisited our decisions. He has deep knowledge of Tableau and genuinely enjoys digging in to address challenges, working with you to ultimately arrive at a great end result.”
Get in touch
Book a free strategy call, or send us a message. Either way, we'll help you turn scattered data into decision-ready dashboards.
info@pnielanalytics.com
+1 302 455 7460
Newark, Delaware
Start the conversation
We use cookies to improve your experience on our site. See our Privacy Policy.